
 US Stocks
 US Options
 Emerging Asia
 GBP Cash Savings
 Charts & Tools
 Paper Trading
 Extended Hours
 Wall Street Journal
3 US Stocks That May Be Trading Below Their Estimated Value
As the U.S. stock market navigates a mixed landscape, with major indices showing varied movements and recent selloffs impacting investor sentiment, opportunities may arise for those looking to identify stocks that are trading below their estimated value. In such an environment, finding undervalued stocks involves assessing companies with strong fundamentals and potential resilience amid broader market fluctuations.
Top 10 Undervalued Stocks Based On Cash Flows In The United States
| Name | Current Price | Fair Value (Est) | Discount (Est) |
| German American Bancorp (NasdaqGS:GABC) | $39.82 | $74.94 | 46.9% |
| Northwest Bancshares (NasdaqGS:NWBI) | $12.65 | $24.45 | 48.3% |
| Old National Bancorp (NasdaqGS:ONB) | $23.97 | $45.88 | 47.8% |
| Sandy Spring Bancorp (NasdaqGS:SASR) | $32.99 | $64.53 | 48.9% |
| Solaris Energy Infrastructure (NYSE:SEI) | $29.34 | $57.34 | 48.8% |
| Incyte (NasdaqGS:INCY) | $71.38 | $135.08 | 47.2% |
| Limbach Holdings (NasdaqCM:LMB) | $83.35 | $160.26 | 48% |
| Array Technologies (NasdaqGM:ARRY) | $6.90 | $13.50 | 48.9% |
| Open Lending (NasdaqGM:LPRO) | $5.44 | $10.49 | 48.2% |
| Haemonetics (NYSE:HAE) | $63.45 | $121.99 | 48% |
We'll examine a selection from our screener results.
Bruker (NasdaqGS:BRKR)
Overview: Bruker Corporation, along with its subsidiaries, is involved in the development, manufacturing, and distribution of scientific instruments and analytical and diagnostic solutions globally, with a market cap of approximately $7.81 billion.
Operations: The company's revenue segments include Bruker Nano at $1.10 billion, Bruker CALID at $1.09 billion, Bruker Biospin at $905.70 million, and Bruker Energy & Supercon Technologies (BEST) at $283 million.
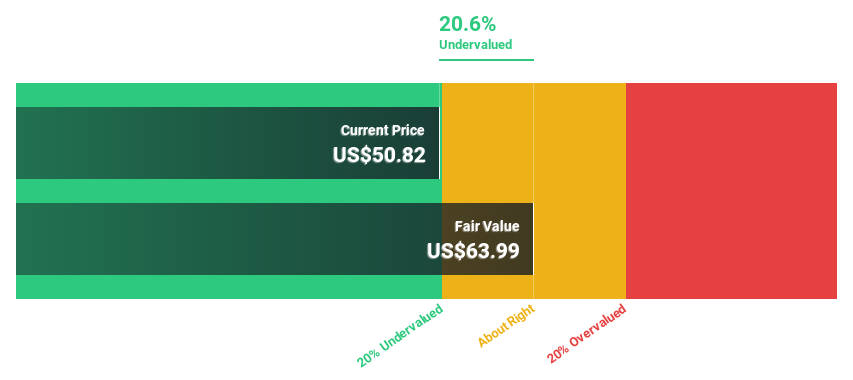
Estimated Discount To Fair Value: 17.3%
Bruker is trading at US$52.92, below its estimated fair value of US$63.96, suggesting it may be undervalued based on cash flows. Despite a decline in profit margins and net income due to large one-off items, earnings are expected to grow significantly over the next three years, outpacing the broader U.S. market. However, Bruker's revenue growth forecast (5.2% annually) lags behind market averages and debt coverage by operating cash flow remains a concern.
- Our growth report here indicates Bruker may be poised for an improving outlook.
- Click to explore a detailed breakdown of our findings in Bruker's balance sheet health report.
Fluence Energy (NasdaqGS:FLNC)
Overview: Fluence Energy, Inc. operates through its subsidiaries to offer energy storage and optimization software for renewable and storage applications across various regions including the Americas, Asia Pacific, Europe, the Middle East, and Africa, with a market cap of approximately $1.34 billion.
Operations: Fluence Energy's revenue primarily comes from its Batteries / Battery Systems segment, which generated $2.52 billion.
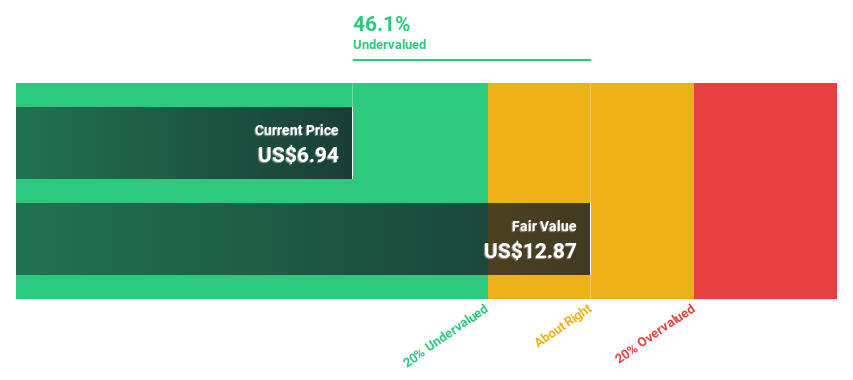
Estimated Discount To Fair Value: 43%
Fluence Energy is trading at US$7.36, significantly below its estimated fair value of US$12.90, indicating potential undervaluation based on cash flows. Despite experiencing a volatile share price and a recent revenue decline to US$186.79 million, earnings are forecasted to grow 42.23% annually as the company moves towards profitability in three years. Recent agreements for large-scale battery storage projects and innovative product launches like Smartstack™ bolster its growth prospects amidst industry challenges.
- The growth report we've compiled suggests that Fluence Energy's future prospects could be on the up.
- Take a closer look at Fluence Energy's balance sheet health here in our report.
Solaris Energy Infrastructure (NYSE:SEI)
Overview: Solaris Energy Infrastructure, Inc. designs and manufactures specialized equipment for oil and natural gas operators in the United States, with a market cap of $2.01 billion.
Operations: Solaris Energy Infrastructure generates revenue primarily through its Solaris Logistics Solutions segment, which accounts for $275.40 million.
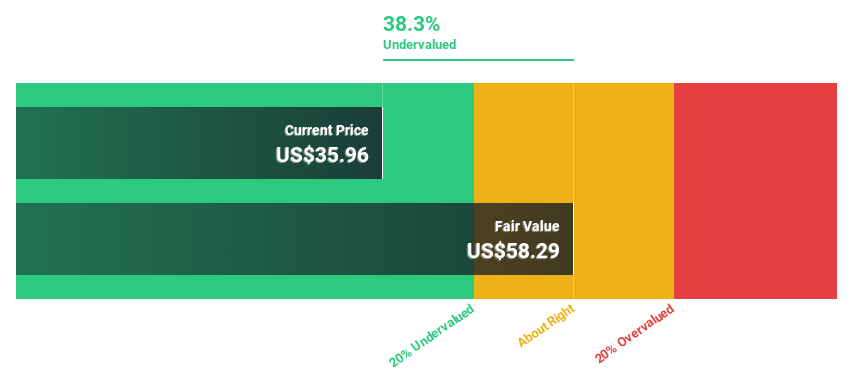
Estimated Discount To Fair Value: 48.8%
Solaris Energy Infrastructure, trading at US$29.34, is significantly undervalued relative to its estimated fair value of US$57.34 based on cash flow analysis. Despite high debt levels and a volatile share price, the company reported increased quarterly revenue of US$96.3 million and net income growth to US$6.25 million year-over-year. Earnings are forecasted to grow substantially at 83% annually, outpacing market averages, although profit margins have declined from 7.6% to 4.6%.
- According our earnings growth report, there's an indication that Solaris Energy Infrastructure might be ready to expand.
- Get an in-depth perspective on Solaris Energy Infrastructure's balance sheet by reading our health report here.
Next Steps
- Embark on your investment journey to our 161 Undervalued US Stocks Based On Cash Flows selection here.
- Are these companies part of your investment strategy? Use Simply Wall St to consolidate your holdings into a portfolio and gain insights with our comprehensive analysis tools.
- Invest smarter with the free Simply Wall St app providing detailed insights into every stock market around the globe.
Interested In Other Possibilities?
- Explore high-performing small cap companies that haven't yet garnered significant analyst attention.
- Diversify your portfolio with solid dividend payers offering reliable income streams to weather potential market turbulence.
- Fuel your portfolio with companies showing strong growth potential, backed by optimistic outlooks both from analysts and management.
This article by Simply Wall St is general in nature. We provide commentary based on historical data and analyst forecasts only using an unbiased methodology and our articles are not intended to be financial advice. It does not constitute a recommendation to buy or sell any stock, and does not take account of your objectives, or your financial situation. We aim to bring you long-term focused analysis driven by fundamental data. Note that our analysis may not factor in the latest price-sensitive company announcements or qualitative material. Simply Wall St has no position in any stocks mentioned.
Have feedback on this article? Concerned about the content? Get in touch with us directly. Alternatively, email editorial-team@simplywallst.com