
 US Stocks
 US Options
 Emerging Asia
 GBP Cash Savings
 Charts & Tools
 Paper Trading
 Extended Hours
 Wall Street Journal
Interface Full Year 2024 Earnings: EPS Beats Expectations
Interface (NASDAQ:TILE) Full Year 2024 Results
Key Financial Results
- Revenue: US$1.32b (up 4.3% from FY 2023).
- Net income: US$86.9m (up 95% from FY 2023).
- Profit margin: 6.6% (up from 3.5% in FY 2023).
- EPS: US$1.49 (up from US$0.77 in FY 2023).
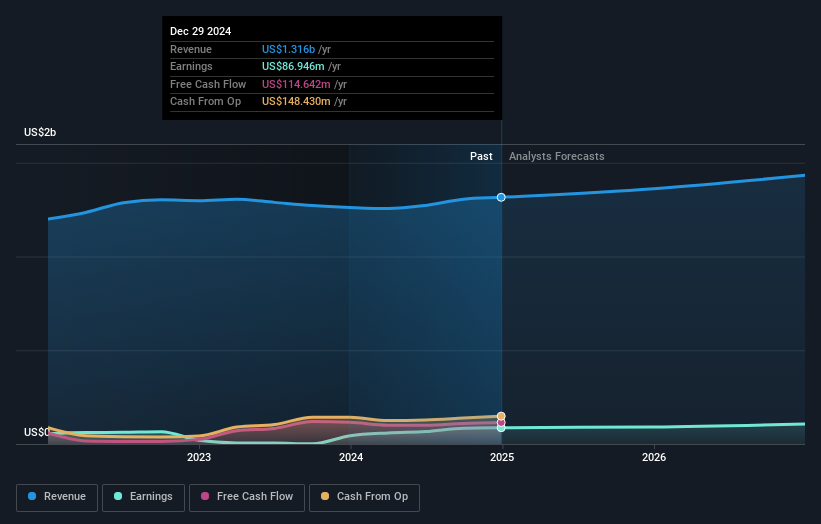
All figures shown in the chart above are for the trailing 12 month (TTM) period
Interface EPS Beats Expectations
Revenue was in line with analyst estimates. Earnings per share (EPS) surpassed analyst estimates by 4.2%.
Looking ahead, revenue is forecast to grow 4.3% p.a. on average during the next 2 years, compared to a 6.7% growth forecast for the Commercial Services industry in the US.
Performance of the American Commercial Services industry.
The company's shares are down 17% from a week ago.
Risk Analysis
You should always think about risks. Case in point, we've spotted 2 warning signs for Interface you should be aware of.
Have feedback on this article? Concerned about the content? Get in touch with us directly. Alternatively, email editorial-team (at) simplywallst.com.
This article by Simply Wall St is general in nature. We provide commentary based on historical data and analyst forecasts only using an unbiased methodology and our articles are not intended to be financial advice. It does not constitute a recommendation to buy or sell any stock, and does not take account of your objectives, or your financial situation. We aim to bring you long-term focused analysis driven by fundamental data. Note that our analysis may not factor in the latest price-sensitive company announcements or qualitative material. Simply Wall St has no position in any stocks mentioned.