
 US Stocks
 US Options
 Emerging Asia
 GBP Cash Savings
 Charts & Tools
 Paper Trading
 Extended Hours
 Wall Street Journal
Onto Innovation Full Year 2024 Earnings: EPS Misses Expectations
Onto Innovation (NYSE:ONTO) Full Year 2024 Results
Key Financial Results
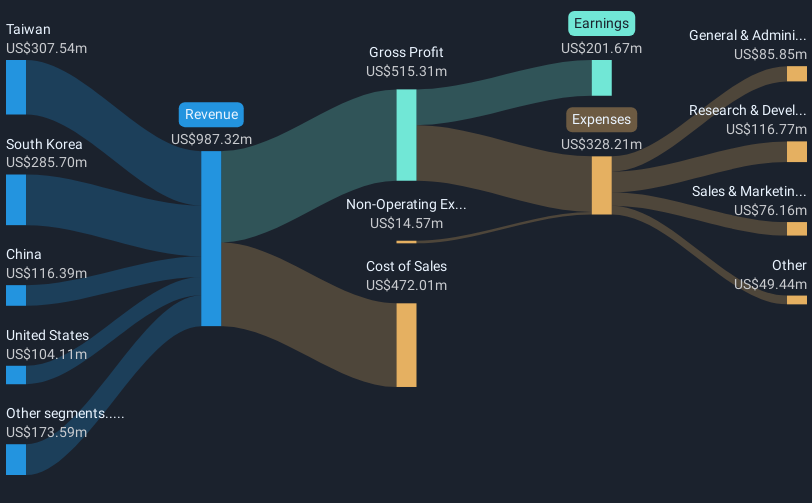
- Revenue: US$987.3m (up 21% from FY 2023).
- Net income: US$201.7m (up 67% from FY 2023).
- Profit margin: 20% (up from 15% in FY 2023). The increase in margin was driven by higher revenue.
- EPS: US$4.09 (up from US$2.47 in FY 2023).
All figures shown in the chart above are for the trailing 12 month (TTM) period
Onto Innovation EPS Misses Expectations
Revenue was in line with analyst estimates. Earnings per share (EPS) missed analyst estimates by 1.0%.
The primary driver behind last 12 months revenue was the Taiwan segment contributing a total revenue of US$307.5m (31% of total revenue). The largest operating expense was Research & Development (R&D) costs, amounting to US$116.8m (36% of total expenses). Over the last 12 months, the company's earnings were enhanced by non-operating gains of US$14.6m. Explore how ONTO's revenue and expenses shape its earnings.
Looking ahead, revenue is forecast to grow 12% p.a. on average during the next 3 years, compared to a 16% growth forecast for the Semiconductor industry in the US.
Performance of the American Semiconductor industry.
The company's shares are down 13% from a week ago.
Balance Sheet Analysis
Just as investors must consider earnings, it is also important to take into account the strength of a company's balance sheet. We have a graphic representation of Onto Innovation's balance sheet and an in-depth analysis of the company's financial position.
Have feedback on this article? Concerned about the content? Get in touch with us directly. Alternatively, email editorial-team (at) simplywallst.com.
This article by Simply Wall St is general in nature. We provide commentary based on historical data and analyst forecasts only using an unbiased methodology and our articles are not intended to be financial advice. It does not constitute a recommendation to buy or sell any stock, and does not take account of your objectives, or your financial situation. We aim to bring you long-term focused analysis driven by fundamental data. Note that our analysis may not factor in the latest price-sensitive company announcements or qualitative material. Simply Wall St has no position in any stocks mentioned.