
 US Stocks
 US Options
 Emerging Asia
 GBP Cash Savings
 Charts & Tools
 Paper Trading
 Extended Hours
 Wall Street Journal
The five-year decline in earnings for CarMax NYSE:KMX) isn't encouraging, but shareholders are still up 47% over that period
It might be of some concern to shareholders to see the CarMax, Inc. (NYSE:KMX) share price down 21% in the last month. But the silver lining is the stock is up over five years. In that time, it is up 47%, which isn't bad, but is below the market return of 167%. Unfortunately not all shareholders will have held it for five years, so spare a thought for those caught in the 32% decline over the last three years: that's a long time to wait for profits.
Although CarMax has shed US$631m from its market cap this week, let's take a look at its longer term fundamental trends and see if they've driven returns.
View our latest analysis for CarMax
To quote Buffett, 'Ships will sail around the world but the Flat Earth Society will flourish. There will continue to be wide discrepancies between price and value in the marketplace...' One imperfect but simple way to consider how the market perception of a company has shifted is to compare the change in the earnings per share (EPS) with the share price movement.
During five years of share price growth, CarMax actually saw its EPS drop 10% per year.
Essentially, it doesn't seem likely that investors are focused on EPS. Because earnings per share don't seem to match up with the share price, we'll take a look at other metrics instead.
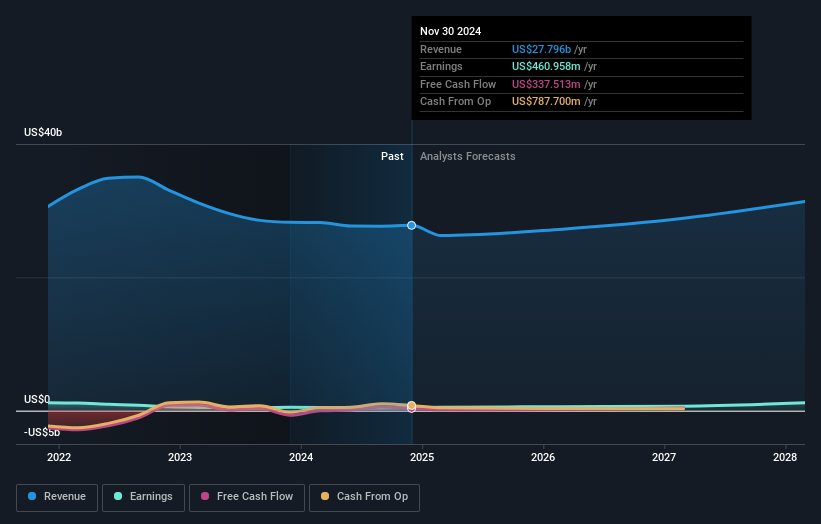
In contrast revenue growth of 7.4% per year is probably viewed as evidence that CarMax is growing, a real positive. In that case, the company may be sacrificing current earnings per share to drive growth.
You can see below how earnings and revenue have changed over time (discover the exact values by clicking on the image).
CarMax is a well known stock, with plenty of analyst coverage, suggesting some visibility into future growth. Given we have quite a good number of analyst forecasts, it might be well worth checking out this free chart depicting consensus estimates.
A Different Perspective
Investors in CarMax had a tough year, with a total loss of 12%, against a market gain of about 11%. Even the share prices of good stocks drop sometimes, but we want to see improvements in the fundamental metrics of a business, before getting too interested. Longer term investors wouldn't be so upset, since they would have made 8%, each year, over five years. It could be that the recent sell-off is an opportunity, so it may be worth checking the fundamental data for signs of a long term growth trend. It's always interesting to track share price performance over the longer term. But to understand CarMax better, we need to consider many other factors. To that end, you should be aware of the 1 warning sign we've spotted with CarMax .
Of course, you might find a fantastic investment by looking elsewhere. So take a peek at this free list of companies we expect will grow earnings.
Please note, the market returns quoted in this article reflect the market weighted average returns of stocks that currently trade on American exchanges.
Have feedback on this article? Concerned about the content? Get in touch with us directly. Alternatively, email editorial-team (at) simplywallst.com.
This article by Simply Wall St is general in nature. We provide commentary based on historical data and analyst forecasts only using an unbiased methodology and our articles are not intended to be financial advice. It does not constitute a recommendation to buy or sell any stock, and does not take account of your objectives, or your financial situation. We aim to bring you long-term focused analysis driven by fundamental data. Note that our analysis may not factor in the latest price-sensitive company announcements or qualitative material. Simply Wall St has no position in any stocks mentioned.