
 US Stocks
 US Options
 Emerging Asia
 GBP Cash Savings
 Charts & Tools
 Paper Trading
 Extended Hours
 Wall Street Journal
We Think Hubbell (NYSE:HUBB) Can Stay On Top Of Its Debt
Warren Buffett famously said, 'Volatility is far from synonymous with risk.' So it seems the smart money knows that debt - which is usually involved in bankruptcies - is a very important factor, when you assess how risky a company is. We note that Hubbell Incorporated (NYSE:HUBB) does have debt on its balance sheet. But the more important question is: how much risk is that debt creating?
Why Does Debt Bring Risk?
Debt is a tool to help businesses grow, but if a business is incapable of paying off its lenders, then it exists at their mercy. In the worst case scenario, a company can go bankrupt if it cannot pay its creditors. However, a more frequent (but still costly) occurrence is where a company must issue shares at bargain-basement prices, permanently diluting shareholders, just to shore up its balance sheet. Of course, debt can be an important tool in businesses, particularly capital heavy businesses. The first step when considering a company's debt levels is to consider its cash and debt together.
What Is Hubbell's Debt?
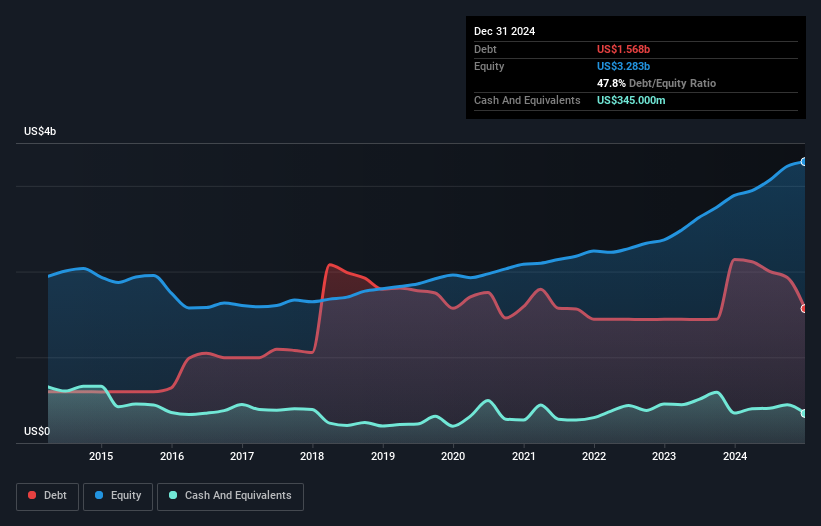
The image below, which you can click on for greater detail, shows that Hubbell had debt of US$1.57b at the end of December 2024, a reduction from US$2.14b over a year. However, it does have US$345.0m in cash offsetting this, leading to net debt of about US$1.22b.
How Strong Is Hubbell's Balance Sheet?
According to the last reported balance sheet, Hubbell had liabilities of US$1.27b due within 12 months, and liabilities of US$2.12b due beyond 12 months. On the other hand, it had cash of US$345.0m and US$794.0m worth of receivables due within a year. So its liabilities outweigh the sum of its cash and (near-term) receivables by US$2.26b.
Given Hubbell has a humongous market capitalization of US$18.4b, it's hard to believe these liabilities pose much threat. Having said that, it's clear that we should continue to monitor its balance sheet, lest it change for the worse.
See our latest analysis for Hubbell
We use two main ratios to inform us about debt levels relative to earnings. The first is net debt divided by earnings before interest, tax, depreciation, and amortization (EBITDA), while the second is how many times its earnings before interest and tax (EBIT) covers its interest expense (or its interest cover, for short). Thus we consider debt relative to earnings both with and without depreciation and amortization expenses.
Hubbell's net debt is only 0.93 times its EBITDA. And its EBIT covers its interest expense a whopping 15.0 times over. So you could argue it is no more threatened by its debt than an elephant is by a mouse. Fortunately, Hubbell grew its EBIT by 5.8% in the last year, making that debt load look even more manageable. When analysing debt levels, the balance sheet is the obvious place to start. But ultimately the future profitability of the business will decide if Hubbell can strengthen its balance sheet over time. So if you're focused on the future you can check out this free report showing analyst profit forecasts.
Finally, a company can only pay off debt with cold hard cash, not accounting profits. So the logical step is to look at the proportion of that EBIT that is matched by actual free cash flow. During the last three years, Hubbell produced sturdy free cash flow equating to 69% of its EBIT, about what we'd expect. This free cash flow puts the company in a good position to pay down debt, when appropriate.
Our View
Happily, Hubbell's impressive interest cover implies it has the upper hand on its debt. And that's just the beginning of the good news since its conversion of EBIT to free cash flow is also very heartening. Zooming out, Hubbell seems to use debt quite reasonably; and that gets the nod from us. After all, sensible leverage can boost returns on equity. Above most other metrics, we think its important to track how fast earnings per share is growing, if at all. If you've also come to that realization, you're in luck, because today you can view this interactive graph of Hubbell's earnings per share history for free.
At the end of the day, it's often better to focus on companies that are free from net debt. You can access our special list of such companies (all with a track record of profit growth). It's free.
Have feedback on this article? Concerned about the content? Get in touch with us directly. Alternatively, email editorial-team (at) simplywallst.com.
This article by Simply Wall St is general in nature. We provide commentary based on historical data and analyst forecasts only using an unbiased methodology and our articles are not intended to be financial advice. It does not constitute a recommendation to buy or sell any stock, and does not take account of your objectives, or your financial situation. We aim to bring you long-term focused analysis driven by fundamental data. Note that our analysis may not factor in the latest price-sensitive company announcements or qualitative material. Simply Wall St has no position in any stocks mentioned.