
 US Stocks
 US Options
 Emerging Asia
 GBP Cash Savings
 Charts & Tools
 Paper Trading
 Extended Hours
 Wall Street Journal
Unveiling Three Top Dividend Stocks For Investors
As the U.S. stock market experiences a rebound, with major indices like the S&P 500 and Nasdaq snapping their losing streaks, investors are closely monitoring opportunities amidst economic uncertainties such as tariffs and fluctuating interest rates. In this environment, dividend stocks can offer a measure of stability and income potential, making them an attractive consideration for those seeking to navigate the current market landscape effectively.
Top 10 Dividend Stocks In The United States
| Name | Dividend Yield | Dividend Rating |
| Douglas Dynamics (NYSE:PLOW) | 4.98% | ★★★★★★ |
| Columbia Banking System (NasdaqGS:COLB) | 5.83% | ★★★★★★ |
| Interpublic Group of Companies (NYSE:IPG) | 4.98% | ★★★★★★ |
| Dillard's (NYSE:DDS) | 7.36% | ★★★★★★ |
| Regions Financial (NYSE:RF) | 6.56% | ★★★★★★ |
| Peoples Bancorp (NasdaqGS:PEBO) | 5.38% | ★★★★★★ |
| Southside Bancshares (NYSE:SBSI) | 4.92% | ★★★★★★ |
| First Interstate BancSystem (NasdaqGS:FIBK) | 6.55% | ★★★★★★ |
| Citizens & Northern (NasdaqCM:CZNC) | 5.49% | ★★★★★★ |
| Isabella Bank (OTCPK:ISBA) | 4.75% | ★★★★★★ |
Click here to see the full list of 160 stocks from our Top US Dividend Stocks screener.
Here's a peek at a few of the choices from the screener.
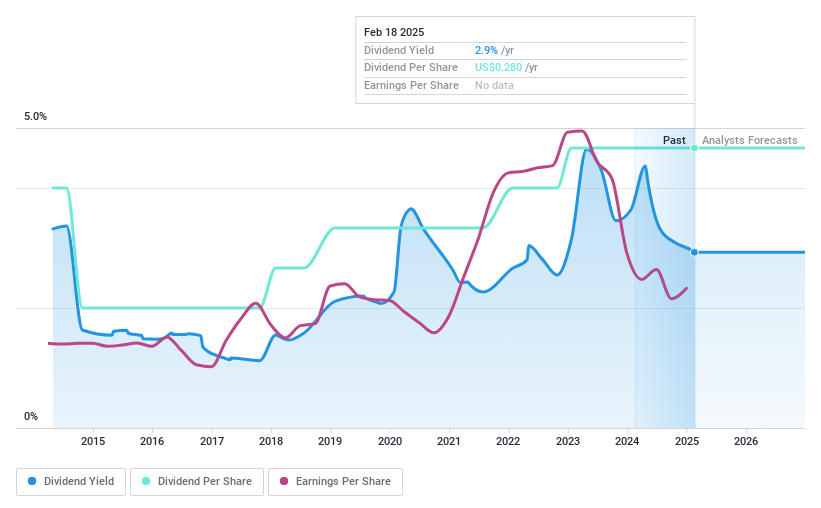
Western New England Bancorp (NasdaqGS:WNEB)
Simply Wall St Dividend Rating: ★★★★☆☆
Overview: Western New England Bancorp, Inc. is the holding company for Westfield Bank, offering a variety of commercial and retail banking products and services to individuals and businesses, with a market cap of approximately $187.83 million.
Operations: Western New England Bancorp generates revenue through its Community Banking segment, which accounted for $73.39 million.
Dividend Yield: 3.1%
Western New England Bancorp's dividend, recently affirmed at US$0.07 per share, is covered by earnings with a payout ratio of 50.2%, though its track record has been volatile over the past decade. Despite trading at 58% below estimated fair value, the company's dividend yield of 3.06% is not among the top tier in the U.S. market. Recent earnings showed improvement with net income rising to US$3.29 million from US$2.51 million year-over-year.
- Click here and access our complete dividend analysis report to understand the dynamics of Western New England Bancorp.
- The analysis detailed in our Western New England Bancorp valuation report hints at an deflated share price compared to its estimated value.
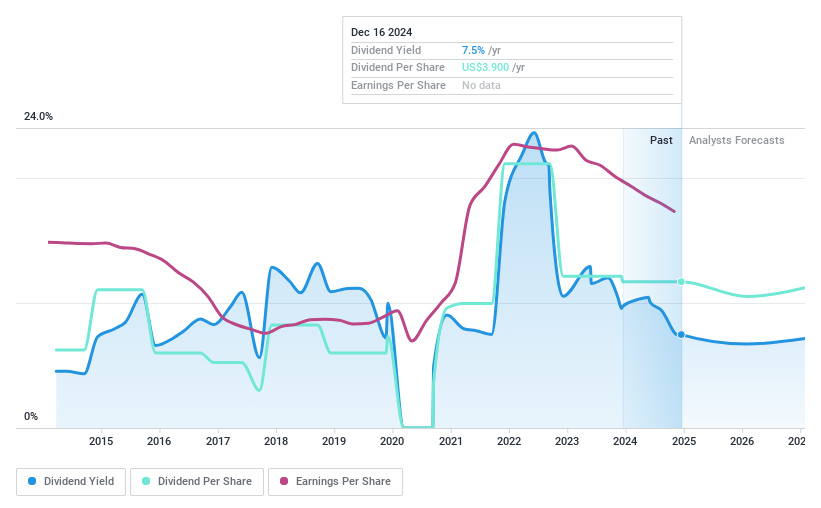
Buckle (NYSE:BKE)
Simply Wall St Dividend Rating: ★★★★☆☆
Overview: The Buckle, Inc. is a U.S.-based retailer specializing in casual apparel, footwear, and accessories for young men and women, with a market cap of approximately $1.95 billion.
Operations: The Buckle, Inc.'s revenue is primarily derived from its sales of casual apparel, footwear, and accessories, totaling approximately $1.22 billion.
Dividend Yield: 10%
Buckle's dividend yield of 9.99% ranks among the top 25% in the U.S., yet it is not well-covered by free cash flows with a high cash payout ratio of 103%. Despite trading at a good value compared to peers, its dividends have been volatile over the past decade. Recent earnings for Q4 showed a slight decline, with net income at US$77.2 million and sales at US$379.2 million, reflecting challenges in sustaining dividend payouts.
- Unlock comprehensive insights into our analysis of Buckle stock in this dividend report.
- Insights from our recent valuation report point to the potential undervaluation of Buckle shares in the market.
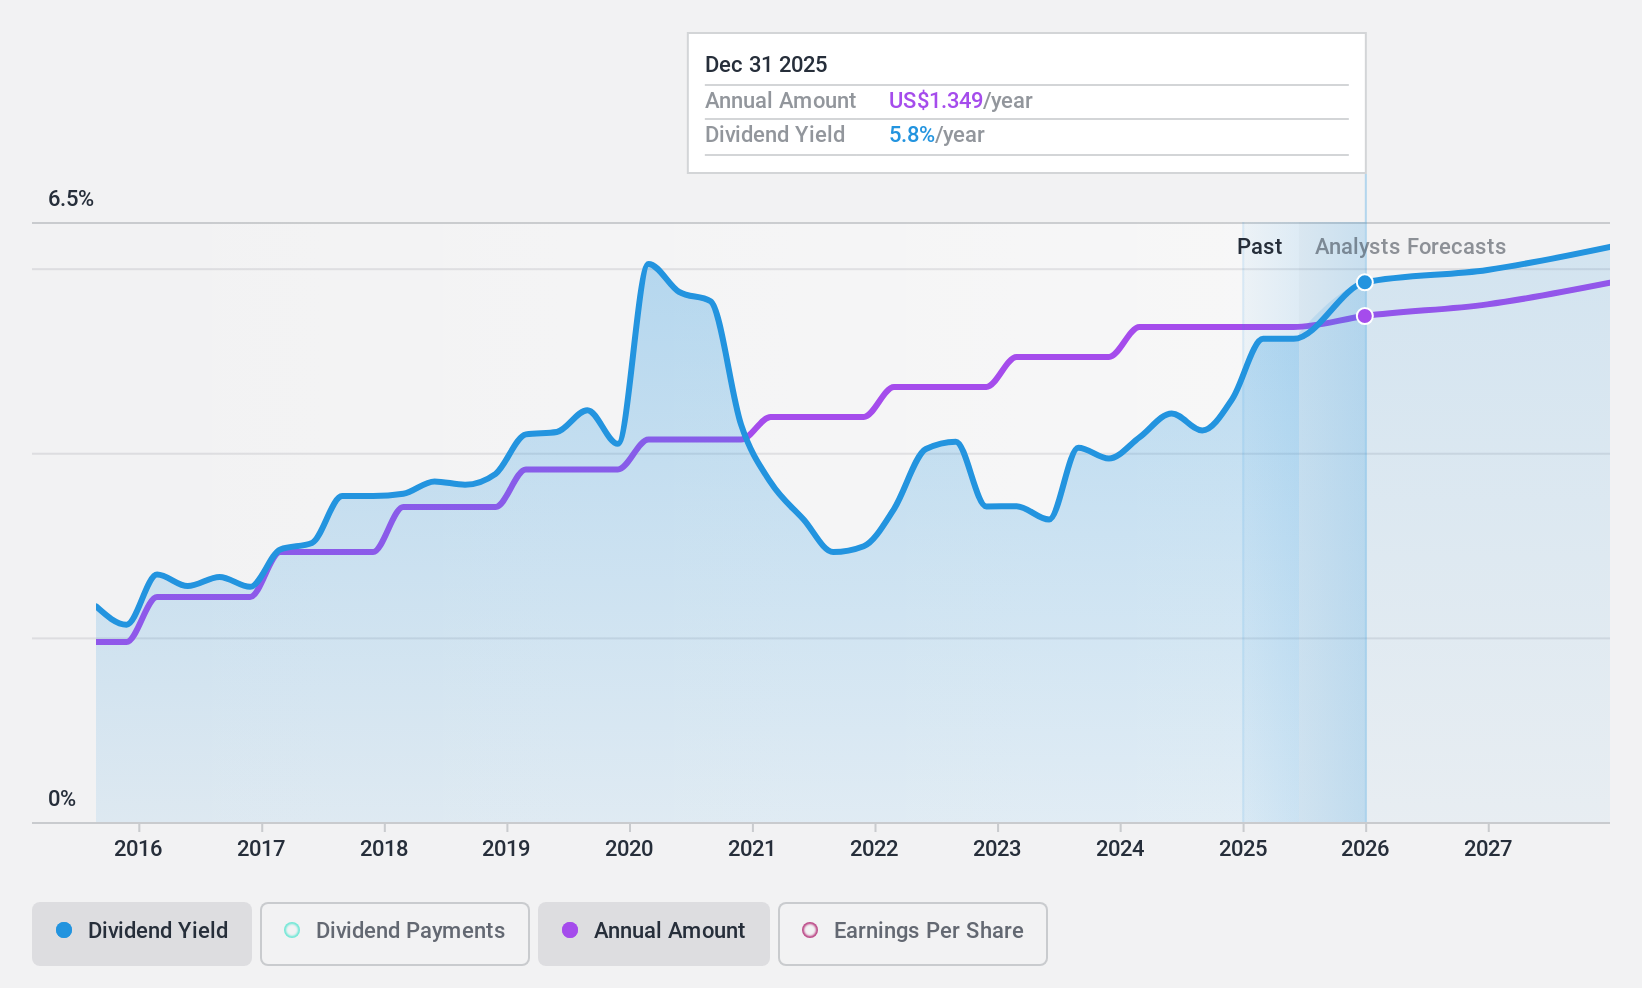
Interpublic Group of Companies (NYSE:IPG)
Simply Wall St Dividend Rating: ★★★★★★
Overview: The Interpublic Group of Companies, Inc. is a global provider of advertising and marketing services with a market cap of approximately $9.88 billion.
Operations: The Interpublic Group of Companies, Inc. generates revenue from three primary segments: Media, Data & Engagement Solutions ($4.21 billion), Integrated Advertising & Creativity Led ($3.54 billion), and Specialized Communications & Experiential Solutions ($1.43 billion).
Dividend Yield: 5%
Interpublic Group's dividend yield of 4.98% is in the top 25% of U.S. payers, supported by a payout ratio of 71.8% and a cash payout ratio of 53.9%, ensuring coverage by earnings and cash flows. Despite stable dividends over the past decade, recent financials show declining net income to US$689.5 million for 2024 from US$1,098.4 million in 2023, alongside reduced profit margins and revenue forecasts predicting further decreases this year by up to 2%.
- Delve into the full analysis dividend report here for a deeper understanding of Interpublic Group of Companies.
- Our comprehensive valuation report raises the possibility that Interpublic Group of Companies is priced lower than what may be justified by its financials.
Seize The Opportunity
- Take a closer look at our Top US Dividend Stocks list of 160 companies by clicking here.
- Are any of these part of your asset mix? Tap into the analytical power of Simply Wall St's portfolio to get a 360-degree view on how they're shaping up.
- Invest smarter with the free Simply Wall St app providing detailed insights into every stock market around the globe.
Want To Explore Some Alternatives?
- Explore high-performing small cap companies that haven't yet garnered significant analyst attention.
- Fuel your portfolio with companies showing strong growth potential, backed by optimistic outlooks both from analysts and management.
- Find companies with promising cash flow potential yet trading below their fair value.
This article by Simply Wall St is general in nature. We provide commentary based on historical data and analyst forecasts only using an unbiased methodology and our articles are not intended to be financial advice. It does not constitute a recommendation to buy or sell any stock, and does not take account of your objectives, or your financial situation. We aim to bring you long-term focused analysis driven by fundamental data. Note that our analysis may not factor in the latest price-sensitive company announcements or qualitative material. Simply Wall St has no position in any stocks mentioned.
Have feedback on this article? Concerned about the content? Get in touch with us directly. Alternatively, email editorial-team@simplywallst.com