
 US Stocks
 US Options
 Emerging Asia
 GBP Cash Savings
 Charts & Tools
 Paper Trading
 Extended Hours
 Wall Street Journal
Leggett & Platt (NYSE:LEG shareholders incur further losses as stock declines 6.9% this week, taking three-year losses to 74%
It's not possible to invest over long periods without making some bad investments. But really big losses can really drag down an overall portfolio. So spare a thought for the long term shareholders of Leggett & Platt, Incorporated (NYSE:LEG); the share price is down a whopping 78% in the last three years. That'd be enough to cause even the strongest minds some disquiet. And over the last year the share price fell 58%, so we doubt many shareholders are delighted. The falls have accelerated recently, with the share price down 17% in the last three months.
With the stock having lost 6.9% in the past week, it's worth taking a look at business performance and seeing if there's any red flags.
To quote Buffett, 'Ships will sail around the world but the Flat Earth Society will flourish. There will continue to be wide discrepancies between price and value in the marketplace...' By comparing earnings per share (EPS) and share price changes over time, we can get a feel for how investor attitudes to a company have morphed over time.
Leggett & Platt has made a profit in the past. On the other hand, it reported a trailing twelve months loss, suggesting it isn't reliably profitable. Other metrics may better explain the share price move.
Arguably the revenue decline of 6.5% per year has people thinking Leggett & Platt is shrinking. After all, if revenue keeps shrinking, it may be difficult to find earnings growth in the future.
The company's revenue and earnings (over time) are depicted in the image below (click to see the exact numbers).
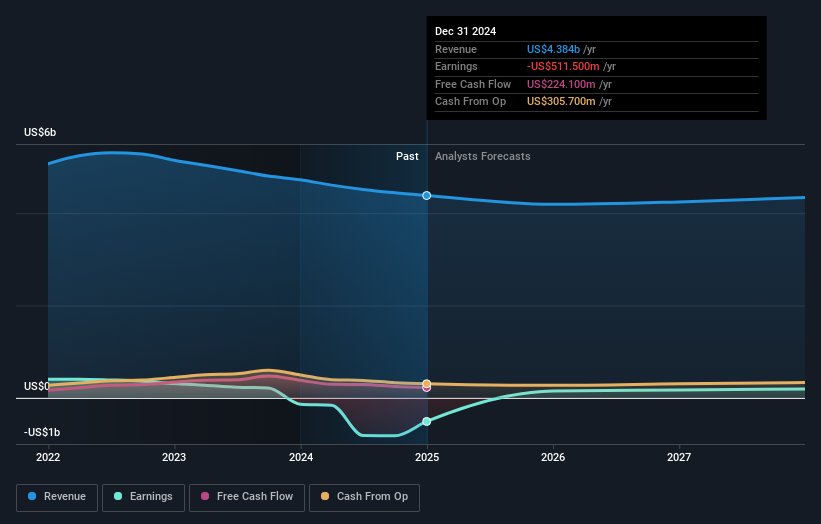
We consider it positive that insiders have made significant purchases in the last year. Having said that, most people consider earnings and revenue growth trends to be a more meaningful guide to the business. You can see what analysts are predicting for Leggett & Platt in this interactive graph of future profit estimates.
What About Dividends?
It is important to consider the total shareholder return, as well as the share price return, for any given stock. Whereas the share price return only reflects the change in the share price, the TSR includes the value of dividends (assuming they were reinvested) and the benefit of any discounted capital raising or spin-off. It's fair to say that the TSR gives a more complete picture for stocks that pay a dividend. In the case of Leggett & Platt, it has a TSR of -74% for the last 3 years. That exceeds its share price return that we previously mentioned. And there's no prize for guessing that the dividend payments largely explain the divergence!
A Different Perspective
Leggett & Platt shareholders are down 57% for the year (even including dividends), but the market itself is up 7.3%. However, keep in mind that even the best stocks will sometimes underperform the market over a twelve month period. Regrettably, last year's performance caps off a bad run, with the shareholders facing a total loss of 10% per year over five years. Generally speaking long term share price weakness can be a bad sign, though contrarian investors might want to research the stock in hope of a turnaround. It's always interesting to track share price performance over the longer term. But to understand Leggett & Platt better, we need to consider many other factors. Take risks, for example - Leggett & Platt has 2 warning signs (and 1 which is potentially serious) we think you should know about.
Leggett & Platt is not the only stock insiders are buying. So take a peek at this free list of small cap companies at attractive valuations which insiders have been buying.
Please note, the market returns quoted in this article reflect the market weighted average returns of stocks that currently trade on American exchanges.
Have feedback on this article? Concerned about the content? Get in touch with us directly. Alternatively, email editorial-team (at) simplywallst.com.
This article by Simply Wall St is general in nature. We provide commentary based on historical data and analyst forecasts only using an unbiased methodology and our articles are not intended to be financial advice. It does not constitute a recommendation to buy or sell any stock, and does not take account of your objectives, or your financial situation. We aim to bring you long-term focused analysis driven by fundamental data. Note that our analysis may not factor in the latest price-sensitive company announcements or qualitative material. Simply Wall St has no position in any stocks mentioned.